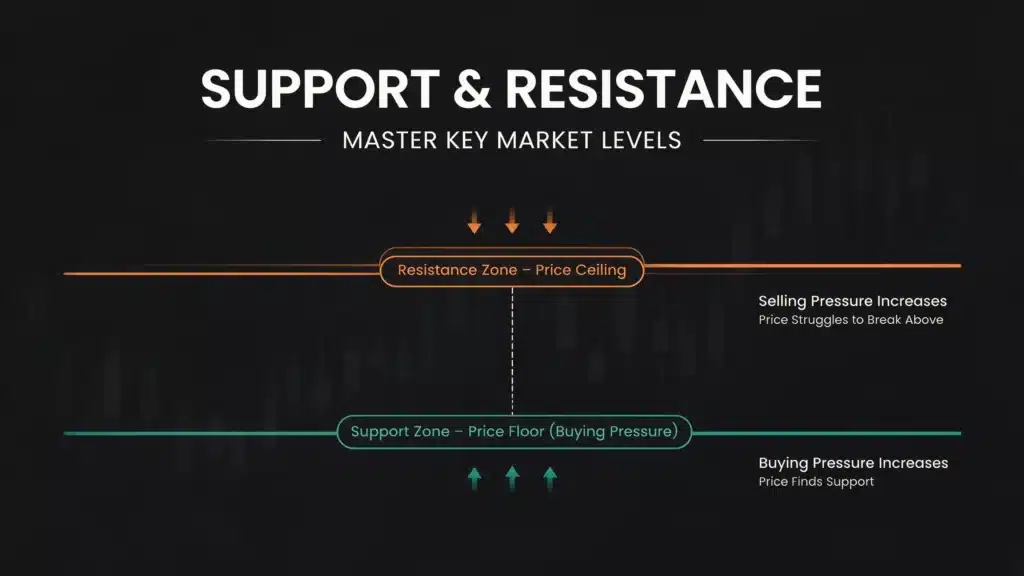
Quick Answer: Understanding support and resistance in stock trading is the foundation of technical analysis. Support acts as a price floor where buying pressure overwhelms selling pressure, while resistance acts as a ceiling where selling pressure stops upward momentum.
Key Takeaways
- Support and resistance in stock trading represent key psychological and structural price levels where supply and demand shift.
- Support functions as a demand zone where buyers step in, preventing prices from falling further.
- Resistance functions as a supply zone where sellers step in, capping upward price movements.
- Mastering these levels helps traders optimize entries, set effective stop-losses, and improve risk management.
Introduction
What are support and resistance in stock trading? If you want to build consistency in the markets, mastering these core price zones is essential. Institutional traders, retail participants, and algorithmic programs all rely on stock market support and resistance to navigate volatility, plan entries, and execute exits.
Whether you are exploring stock market terms for beginners or diving into price action, this guide covers everything you need to know about reading charts effectively using technical analysis.
What Is Support in Stock Trading?
Definition and Meaning
A support is a price level at which a stock will stop dropping because buyers’ interest exceeds the pressure from sellers. A falling stock price towards the historical support zone means there is more demand than supply, which in turn means that it cannot keep declining further.
Demand Zone Concept and Example
To think of support as a trampoline floor. If a stock has been trading from ₹1000 to ₹800 and has bounced back a number of times, ₹800 is considered to be a strong demand zone. It is near this price that buyers intervene aggressively as they consider the stock to be undervalued.
Internal Link: To understand foundational terminology before analyzing charts, check out our guide on Stock Market Terms for Beginners.
What Is Resistance in Stock Trading?
Seller Psychology and Supply Zone
A price ceiling that a share price will approach when it is moving upward, due to the fact that selling interests outpace buying interests, is called resistance. The higher it climbs, the more buyers who are seeking to take profits and short sellers who are entering into new positions build a weight of supply.
Real Market Example
In the above example, the price of an IT stock moves up from ₹1,500 to ₹1,800 and then continues to go down consistently at ₹1,800, this is a resistance ceiling. Sellers control this area, making any breakout at this time impossible.
How Support and Resistance Levels Work
Price Memory and Market Psychology
How it works and why it matters.Understanding Price Memory and Market Psychology.
Markets have memory. The institutional investors, hedge funds and retail players can recall previous price extremes that witnessed high volume transactions. As prices get back within these historical bands, psychological responses lead to repeat behavior.
Institutional Buying and Nifty Example
Major institutional orders are often clustered around key stock market support and resistance thresholds. For instance, when index heavyweights or the Nifty index approach crucial psychological milestones, massive institutional liquidity defends those zones, creating sharp trend reversals.
Why Support and Resistance Matter
- Better Entries: Most trades are made at the points where prices are near support areas which helps to achieve higher reward to risk ratios.
- Better Exits: Take profit near resistance to avoid giving away any open profits.
- Stop-Loss Placement: The stop-loss placement is the placing of a stop-loss past the support or resistance, which thus eliminates a failed setup.
- Profit Booking: Systematic selling of the positions close to the big supply walls.
- Risk Management: Hedging against downside risk: knowing what happens when the structure of the market collapses.
How Support and Resistance Levels Are Formed
- Historical Price Action: Prior to the chart reversal, these price reversal zones were burned into the chart over the course of weeks or months.
- Supply and Demand Equilibrium: Locations where buyers and sellers made no difference.
- Multiple Price Rejections: Areas where the candles wicked or closed a number of times but never burned through.
- Institutional Orders: There are large block-orders at definite structural boundaries.
- Round Numbers: Psychological Prices Milestones like ₹100, ₹500, ₹1,000 which are where retail and institutional orders naturally tend to accumulate.
How to Identify Support and Resistance Levels
- Swing Highs: Peaks where price paused and reversed downward.
- Swing Lows: The lows in the charts that prices have bottomed and turned higher.
- Trendlines: Dynamic boundaries sloping from several highs or lows.
- Previous Highs and Lows: Bar chart highs/lows from the previous daily or weekly periods.
- Fibonacci Levels: Reversal levels (such as 38.2%, 50% and 61.8%).
- Pivot Points: Mathematical points calculated from past session’s high, low and close.
- Moving Averages: important institutional averages as moving barriers.
Different Types of Support and Resistance
- Horizontal Support & Resistance: Classic horizontal price zones that were respected on longer time frames.
- Dynamic Support & Resistance: Moving averages that change on each new candle.
- Trendline Support & Resistance: Tilted levels that enclose trending markets.
- Moving Average Support: 50-Day or 200-Day moving averages as trend floors.
- Fibonacci Support: Zone that shields impulses.
- Psychological Support: Round number milestones that are followed by all traders.
How to Draw Support and Resistance Correctly
To master how to identify support and resistance without cluttering your charts, follow this 5-step framework:
- Step 1: Go to the Daily chart of your stock or index of choice to see macro structure.
- Step 2: Target highs that were major swing highs that failed to make it.
- Step 3: look for major swing lows as sellers have run out of supplies.
- Step 4: Add zones – these are not always thin lines, but rather areas that price action tends to test instead of the exact decimal points.
- Step 5: Work on finer time frames, such as the 15-minute chart, for execution levels.
Best Indicators to Confirm Support and Resistance
- RSI (Relative Strength Index): Identifies overbought or oversold bounces at support or resistance levels.
- Moving Averages: Dynamic trend floors and ceiling are confirmed by Moving Averages: 50 and 200 EMAs.
- Volume: The volume must be strong for high-volume spikes that happen near support or resistance to be a sign of institutional interest.
- VWAP (Volume Weighted Average Price): An important intraday indicator of institutional balance.
- MACD: Contrary, the Average Directional Index (ADX) shows a potential trend exhaustion situation in and near important areas where the trend is likely to reverse.
- Bollinger Bands: The outer bands are used to identify volatility support and resistance levels.
Tip: Use price action zones in conjunction with volume and momentum indicators to get rid of false signals.
Support and Resistance Trading Strategies
Strategy 1: Range Trading
- Execution: Buy when horizontal support is found and sell when resistance is found in a given channel.
Strategy 2: Breakout Trading
- Execution: See a strong wick candle that closed past resistance with high volume, and then retest before buying. g.
Strategy 3: Support Bounce Strategy
- Execution: buy when price comes close to a historical price demand level and is forming a bullish reversal pattern (such as a hammer or engulfing candle).
Strategy 4: Resistance Rejection Strategy
- Execution: When price approaches a supply ceiling, there are bearish rejection wicks, and short/Exit positions are taken.
Strategy 5: Role Reversal Strategy
- Execution: If it is a broken resistance that has been replaced by a new resistance, or a broken support which is replaced by a new support, then the classic flip is the standard way to execute.
False Breakouts Explained
What Is a False Breakout and Why Does It Happens?
A false breakout occurs when price briefly breaches a support or resistance level but immediately reverses back inside the range. These traps are often caused by institutional liquidity grabs and stop-loss hunting, where large players trigger retail stop orders to accumulate positions.
How to Avoid False Breakouts
- Wait for Candle Close: Do not go in on a wick break alone, wait for candle close confirmed outside the zone.
- Volume Confirmation: Make sure that breakout bars have above average volumes.
- Multi-Timeframe Analysis: Confirm breakout credibility using other timeframes (e.g., Hourly or Daily charts).
Common Mistakes Traders Make
- Drawing too many cluttered lines on a single chart.
- Trading every minor breakout without structural context.
- Ignoring volume and market breadth data.
- Neglecting higher timeframe alignment.
- Trading without strict stop-loss protection.
- Succumbing to emotional FOMO or panic.
- Using overly tight stop-losses that get clipped by normal market noise.
Support vs. Resistance Comparison Table
| Attribute | Support | Resistance |
| Market Zone | Buying Zone (Demand) | Selling Zone (Supply) |
| Price Function | Acts as a price floor | Acts as a price ceiling |
| Market Sentiment | Bullish reversal expected | Bearish reversal expected |
| Optimal Action | Entry area for long positions | Exit or short area |
Best Timeframes for Support and Resistance
- Scalping: 1 – 5 minute charts for the quickest intraday trading.
- Intraday Trading: 15 Minute charts for balancing noise and direction. (Explore applications in our guide on Consistent Intraday Trading Profits in India)
- Swing Trading: Daily time frames for multi-day structure.
- Positional Trading: This is for the weekly charts, do macro investing and long term trend analysis!
Real Trading Example Using Support and Resistance
Suppose the price of a stock is trading above a significant daily support level at ₹500:
- Entry: When you see a bullish hammer candle with increasing volume at ₹500, it’s time to enter. You buy at ₹505.
- Stop-Loss: ₹490.00, which is placed securely below the support floor.
- Target: Set near the overhead resistance ceiling, at ₹545.
- Risk-Reward: Risking Rs 15 per share and making Rs 40 = an exceptional 1:2.6 risk reward ratio.
Best Trading Platforms for Support and Resistance Analysis
Having a good set of charting tools is essential for analyzing and executing trades with ease. Some of the most popular trading platforms in India are:
- TradingView: Advanced charting tools and indicators in industry standard trading platform.
- Zerodha Kite: Simplicity in interface and seamless integration with NSE/BSE.
- Upstox: Highly sophisticated analytical overlays and quick execution terminals.
- Angel One: All-in-one research tools for retail participants.
- Groww: An easy-to-use platform perfect for startups and novice investors.
- Dhan: Dhan is designed specifically for active traders, who can enjoy ultra-fast charting functionality.
How Beginners Can Master Support and Resistance Faster
- Learn to chart daily, on various asset time frames.
- Test price movements in the past with platform replay modes.
- Keep a detailed trading journal to analyse losing and winning trades.
- Test the strategy using the back testing system thoroughly on market cycles.
- Focus on higher time frame charts first then go down to intraday charts.
- Deepen your overall technical analysis foundation. (Enhance your expertise with our Advanced Technical Analysis Course)
Frequently Asked Questions
Q1. What is support and resistance in stock market technical analysis?
Ans: Support and resistance are important price points that have shown a concentration of buyers or sellers activity and are areas of price stalls or reversal.
Q2. What is the difference between support and resistance?
Ans: With support, there is a minimum price limit that the demand will not drop below and with resistance, there is a maximum price limit that supply will not advance beyond.
Q3. How do support and resistance levels work?
Ans: They operate according to the market memory and institutional psychology, which means that the places of high volume reaction will attract interests from old buyers and sellers.
Q4. How do I identify strong support and resistance levels?
Ans: They are identified by looking for historical swing highs, swing lows, volume concentration nodes and multi-test price rejection zones.
Q5. How do I draw support and resistance lines?
Ans: Draw them as horizontal bands or not as narrow lines from several touch points within a daily or weekly chart.
Q6. Are support and resistance levels reliable?
Ans: Yes, if viewed in conjunction with volume confirmation, sound risk management, and the proper time frame context, they can provide high probability trading edges.
Q7. Which indicator works best with support and resistance?
Ans: The volume indicator, Moving Averages and Relative Strength Index (RSI) are some of the most effective ones to confirm support and resistance reactions.
Q8. What happens when support breaks?
Ans: If established support fails, it will likely result in a sudden decline, and old support levels can become resistance.
Q9. What happens when resistance breaks?
Ans: Any confirmed breakout above resistance represents strong momentum bulls and often resistance becomes a new support level.
Q10. Can support become resistance?
Ans: Yes. This is called a role reversion/polarity shift.
Q11. Can beginners trade using support and resistance?
Ans: Absolutely. One of the most dependable, rule-based systems for new traders to master price action without using lagging indicators.
Q12. Which timeframe is best for support and resistance trading?
Ans: In swing trading, daily and hourly charts are the most suitable and in intraday trading 15 minute chart is more suitable.
Q13. What are false breakouts?
Ans: When price briefly penetrates a structure and then bounces back with a strong move, it is referred to as a false breakout and can leave traders who have entered the market based on that swing violently out of the market.
Q15. How can support and resistance improve trading accuracy?
Ans: They offer objective entries, logical stop-loss placement and clear profit targets without emotions.
Q16. Which charting software provides advanced support and resistance tools in India?
Ans: TradingView, Zerodha Kite, and Dhan are other platforms that provide advanced drawing tools and indicators, enabling precise technical analysis.
Conclusion
Understanding support and resistance in stock trading is essential for reading market structure, managing risk, and spotting high-probability trade setups. Remember that support functions as a buying zone, resistance acts as a selling zone, and patient confirmation combined with volume analysis is your best defense against false breakouts. Never trade without strict risk management rules in place.
Ready to elevate your trading mastery? Explore comprehensive learning pathways at Trading Smart Edge. Whether you want to refine your chart reading through our Advanced Technical Analysis Course or master short-term setups via Consistent Intraday Trading Profits in India, our expert-led modules are designed to turn you into a disciplined, confident market participant.
Enroll in our programs today and take full control of your trading journey!
Recommended Internal Links
- Stock Market Terms for Beginners
- Consistent Intraday Trading Profits in India
- What Are Call and Put Options Explained Simply?
- Future & Option Trading vs Cash Market
- How to Protect Your Portfolio During Market Crashes
- What Are the Biggest Mistakes Traders Make?
- What Are Circuit Breakers in the Stock Market?
- What Is Portfolio Diversification and Why Is It Important?
- How to Analyze Balance Sheets to Pick Stocks
- Average Stock Market Returns in India