You stare at the chart. You drew the support line perfectly. It connected three previous swing lows. You wait patiently, the price drops to your line, and you execute your buy order. For a brief moment, it bounces. You feel like a genius.Then, violently, the price slices through your line, triggers your stop-loss, and immediately reverses back in your original direction. You were right about the trend, but you still lost money. Sound familiar?
If you have spent any time navigating the Indian financial markets, you have likely been a victim of a breakout failure. You have been hunted for liquidity. The brutal reality of the stock market is that retail traders are consistently fed outdated methodologies that institutional players actively exploit. Retail draws lines; institutions build zones.
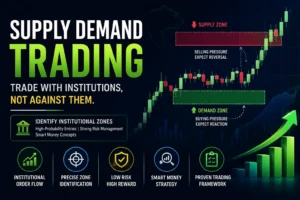
If you want to stop serving as exit liquidity for massive hedge funds and banks, you must fundamentally alter how you view price action. You must transition to supply demand trading. This comprehensive guide will completely dismantle the way you look at charts, teaching you how to track the undeniable footprints of institutional capital, identify high-probability zones, and execute with surgical precision.
Quick Answer: What is supply demand trading?
| Supply demand trading is a methodology that identifies precise areas on a chart where massive institutional orders remain unfilled. Instead of drawing thin retail support and resistance lines—which are easily manipulated—traders draw rectangular zones at the origin of explosive price movements. By waiting for price to return to these specific institutional footprints, you align your entries with smart money, drastically improving your risk-to-reward ratio and shielding your capital from common liquidity traps. |
Table of Contents
The Fatal Flaw of Retail Support and Resistance
To understand why supply demand trading is so fiercely effective, you first have to understand why traditional support and resistance fails so often. Retail trading education usually teaches you to find levels where price has bounced multiple times. The logic assumes that because a floor held three times in the past, it is exceptionally strong and will hold a fourth time.
Institutional traders know you believe this.
When a massive bank wants to buy 5 million shares of Reliance Industries, they cannot just click a button. If they buy at market price, they will clear out the entire order book, causing the price to skyrocket and ruining their average entry cost. To buy 5 million shares without moving the market prematurely, they need 5 million shares of sell orders waiting for them.
Where do they find a massive cluster of sell orders? Right below your retail support line.
When price dips below that obvious line, two things happen simultaneously: retail stop-losses (which are sell orders) are triggered, and breakout traders initiate new short positions (more sell orders). The institution scoops up all this manufactured liquidity, filling their massive buy order at a discount, and the price instantly reverses upward. This engineered maneuver is a classic liquidity trap. To genuinely grasp how these structural market forces work, establishing a rigorous technical analysis foundation is absolutely non-negotiable.
What Exactly is Supply Demand Trading?
Supply demand trading completely ignores how many times a price has bounced at a level. In fact, in this methodology, the more times a zone is tested, the weaker it becomes.
The core philosophy of supply demand trading is rooted in the mechanics of order flow. When an institution initiates an aggressive, explosive move in the market, they rarely get their entire order filled at their desired price.
Imagine an institution wants to buy 10 million shares at ₹1,000. They manage to acquire 6 million shares, but the sheer aggression of their buying causes the price to explode upwards to ₹1,050. They are not going to chase the price. They pause their buying.
What happens to the remaining 4 million shares they still want to buy? Those orders sit passively on the exchange ledger at ₹1,000, waiting.
That origin point—the specific base where the explosive move began—is a demand zone. Supply demand trading dictates that we do not chase the explosive move. We patiently wait days, weeks, or even months for the price to naturally drift back down to that origin point. When it does, those massive unfilled institutional orders act as a trampoline, triggering a high-probability reversal.
The CME Group’s educational literature on order book dynamics frequently highlights how these massive resting orders dictate price velocity far more than retail sentiment ever could.
The Anatomy of Institutional Zones
In supply demand trading, we categorize market structure into four distinct formations. Learning to identify these patterns instantly is the first step toward building financial acumen that rivals proprietary trading desks.
1. Rally-Base-Rally (RBR) – Demand Zone
This is a continuation pattern. The price is trending upward (Rally), pauses to consolidate tightly for a few candles (Base), and then explodes upward again (Rally). The Base represents a massive accumulation of institutional buy orders. When the price eventually retraces to this Base, supply demand trading rules indicate a high-probability buy setup.
2. Drop-Base-Rally (DBR) – Demand Zone
This is a reversal pattern. The price is falling sharply (Drop), halts and moves sideways (Base), and then violently reverses direction to the upside (Rally). This indicates that institutional buyers stepped in, completely absorbed the selling pressure, and overwhelmed the market. The resulting origin zone is a premier target for supply demand trading entries.
3. Drop-Base-Drop (DBD) – Supply Zone
This is a bearish continuation. The market is bleeding lower (Drop), consolidates briefly (Base), and resumes its aggressive downward plunge (Drop). The Base is a pocket of extreme institutional selling. If the market eventually rallies back to this ceiling, supply demand trading practitioners look to initiate short positions.
4. Rally-Base-Drop (RBD) – Supply Zone
The bearish reversal pattern. Price climbs aggressively (Rally), stalls as smart money unloads their inventory (Base), and collapses downward (Drop). This is the hallmark of a distribution phase. It is the exact zone where supply demand trading systems wait to strike when retail traders foolishly buy into a late-stage rally.
How to Find Genuine Zones on Your Charts
You cannot just draw rectangles around random pauses in the market. True supply demand trading requires strict adherence to identifying specific candle structures.
Step 1: Hunt for the ERC (Extended Range Candle)
Your eyes should not be looking for the Base first. You must look for the explosion. Scan your chart for massive, unusually large candles that close near their absolute highs (for bullish moves) or lows (for bearish moves). These are called Extended Range Candles (ERCs).
An ERC proves that supply and demand were completely out of balance. Retail traders cannot create an ERC on a massive index like the Nifty 50. Only deep-pocketed institutions can force that kind of momentum. This is the cornerstone of supply demand trading.
Step 2: Identify the Origin (The Base)
Once you locate the explosive ERC, look immediately to the left. You are looking for the tight consolidation area right before the explosion occurred. The Base usually consists of one to six smaller candles, often showing indecision (like Dojis or spinning tops). This small cluster is where the institution quietly built their massive position before launching the price.
Step 3: Draw the Zone Geometry
Precision matters in supply demand trading. You draw your zones using two distinct boundaries:
| The Proximal Line: This is the line closest to current price action. For a demand zone, draw this line at the highest body of the Base candles. The Distal Line: This is the absolute extreme boundary. For a demand zone, draw this line at the absolute lowest wick of the entire Base structure. |
The space between the Proximal and Distal lines is your institutional execution arena.
Grading the Zone: The 5-Point Quality Checklist
Every zone is not created equal. If you take every single setup you find, your win rate will suffer. Elite supply demand trading requires a strict filtering mechanism. At Trading Smart Edge (TSE) in Pitampura, our curriculum emphasizes rating these zones mathematically to strip away emotional bias.
Before executing a trade, run the zone through this five-point quality checklist:
1. Strength of the Departure
How violently did the price leave the Base? Did it crawl away slowly, or did it launch like a rocket with consecutive, massive ERCs? The stronger the departure, the higher the structural imbalance, and the higher the probability that the supply demand trading setup will work.
2. Time Spent at the Base
Institutions want to enter the market quickly. If the Base consists of fifteen or twenty tightly packed candles, it means buyers and sellers were relatively balanced for a long time. The best supply demand trading zones feature a Base of just one to four candles. Less time at the Base equals a higher intensity of unfilled orders.
3. Freshness of the Zone
This is where supply demand trading diverges completely from retail logic. A zone is only valid on its very first retest.
When the price returns to a demand zone for the first time, it triggers the maximum number of unfilled institutional orders. If it returns a second or third time, those orders have already been absorbed. The floor is weakening. Trade fresh zones exclusively.
4. Reward-to-Risk Distance
If your stop-loss (placed slightly below the Distal line) requires a 20-point risk, the next opposing supply zone must be at least 40 to 60 points away. If the chart structure does not offer a clear, unobstructed path for a minimum 1:2 risk-to-reward ratio, you skip the trade. Capital preservation must dictate your execution. To understand how to properly calculate and enforce these exact fractional boundaries, implementing strict rules for managing risk in the Indian stock market is completely vital.
5. Institutional Context and Market Trend
A pristine demand zone forming on a 15-minute chart is completely useless if the daily and weekly macro trends are in a violent freefall. The highest tier of supply demand trading involves executing setups that align flawlessly with higher timeframe institutional bias. You want the macroeconomic wind at your back.
Major fundamental shifts—such as interest rate changes analyzed by bodies like the Reserve Bank of India—dictate the macro trend. Your localized zones are simply the tactical entry mechanisms to board that larger moving train.
Executing the Supply Demand Trading Strategy
Once a pristine zone is identified and graded, the physical act of execution requires intense discipline. There are two primary methodologies used to enter the market within this framework.
The Touch Trade (Aggressive)
The moment the price pierces the Proximal line of your zone, your limit order is instantly triggered.
| Pros: You guarantee you will not miss the trade if the price barely taps the zone and rockets away. You secure the absolute best entry pricing. Cons: You are stepping in front of a moving train. If macroeconomic news drops and the price slices straight through your zone, you suffer an immediate loss. |
The Confirmation Trade (Conservative)
You wait for the price to enter your supply demand trading zone, but you do not buy blindly. You wait for the price to halt, form a localized structural shift (like a 5-minute bullish engulfing candle or a micro market structure break), and then enter on the reversal.
| Pros: Drastically higher win rate. You force the market to prove that institutional buyers are actually defending the zone before you risk your capital. Cons: You will occasionally miss trades that reverse too quickly without offering a clean confirmation pattern, and your initial entry price will be slightly worse. |
Regardless of your entry style, your stop-loss placement is immutable. It must sit just outside the Distal line of the zone, buffered slightly by the Average True Range (ATR) to avoid erratic volatility spikes.
Understanding Liquidity Traps and Breakout Failures
If you genuinely want to master supply demand trading, you must understand the architecture of a trap. The market is a zero-sum environment. For an institution to generate massive wealth, capital must be extracted from the undisciplined retail sector.
We call these structural anomalies “breakout failures.” You will often see a stock price approach a historical resistance ceiling. Retail traders watch the price inch above the line, assume a breakout is occurring, and rush to buy aggressively.
However, a master of supply demand trading looks at the larger chart and notices a massive, unmitigated daily Supply Zone sitting exactly 0.5% above that retail breakout line.
The entire breakout was engineered. The institution drove the price just high enough to trigger retail greed, generating a flood of buy orders. The institution then unloads their massive sell inventory into that retail buying pressure perfectly within their supply zone. The breakout violently collapses, leaving the retail traders trapped at the absolute top of the move.
We emphasize decoding these exact institutional traps heavily at the TSE Institute. Understanding where retail pain is maximized is where the most lucrative supply demand trading setups are born. To fully comprehend how to protect your portfolio during these engineered intraday sweeps, dissecting how professionals build consistent intraday profits offers an invaluable perspective.
Building a Complete Trading Plan Around Zones
Knowing how to draw a rectangle on a screen does not make you a profitable trader. Supply demand trading is a conceptual framework; it must be encased within a rigid, mechanical trading plan to yield actual financial results.
The most dangerous phase for a developing trader is the illusion of competence. You spot three great zones, win three trades, and suddenly increase your position size fivefold, abandoning all rules. This is exactly where the market humbles you.
A professional supply demand trading plan requires absolute, documented transparency. You must log every single execution. What was the grading score of the zone? What was the higher timeframe trend? What was your psychological state during the entry?
We believe so strongly in this concept of documented execution that it forms the foundation of our philosophy. An unshakeable edge requires brutal self-honesty. A public or rigorous private journal forces you to face the data. If you realize your Nifty 50 demand zones work 65% of the time, but your Bank Nifty zones only work 30% of the time, the data dictates that you instantly cease trading Bank Nifty. You cannot improve what you do not measure.
For individuals looking to methodically transition from chaotic guessing to an organized, metric-driven approach, following a structured 8-week stock trading plan is an exceptional way to lock these habits into your daily routine.
The Psychological Friction of the Methodology
Supply demand trading requires a massive rewiring of your cognitive behavior. Human beings are biologically programmed to seek comfort in the herd. When a stock price is violently collapsing, glowing red on your screen, with every news anchor screaming about an economic meltdown, every instinct in your body will tell you to sell.
Supply demand trading demands the exact opposite. It demands that you place a limit buy order directly in the path of that collapsing knife, purely because a mechanical zone dictates that institutional unfilled orders reside there.
You must learn to act with complete emotional detachment. You are executing a statistical edge. You do not care if the next individual trade wins or loses; you care about the net outcome of your next one hundred executions.
According to massive regulatory studies published by the Securities and Exchange Board of India (SEBI), the overwhelming majority of individual traders in the derivatives segment incur net financial losses. They fail primarily because they let fear and greed dictate their actions rather than relying on an unemotional, tested statistical framework.
The Role of Structured Mentorship in Market Success
Attempting to decode institutional order flow entirely in isolation is an incredibly painful and expensive journey. You can read textbooks on supply demand trading, watch countless free video modules, and memorize the definitions of an ERC candle. But theoretical literacy does not equal execution capability.
When your screen is flashing, live capital is on the line, and the matching engine is accelerating, conceptual knowledge evaporates. The gap between knowing what a zone looks like and successfully trading it under pressure is immense.
This is where the environment you learn in dictates your ultimate survival. Free content gives you definitions; it does not give you real-time correction. It takes a solitary beginner hundreds of expensive losses to recognize the behavioral biases that a seasoned mentor can identify in a single live session.
For ambitious participants looking to compress this brutal trial-and-error timeline, shifting from isolated chart staring to a physical, mentor-led environment is a profound upgrade. Immersive environments that pair theoretical supply demand trading mechanics with live-market execution data help you identify execution flaws before they destroy your account capital.
Knowing how to filter through the massive noise of the education industry is critical. By actively learning how to properly choose a reliable trading academy in Delhi NCR, you ensure you are absorbing financial acumen from active, battle-tested market practitioners rather than theoretical salespeople. The goal is to build a self-reliant edge that lasts for decades, allowing you to view the market through the lens of institutional reality.
The Global Mindset: Institutional Trust and Financial Acumen
The concepts governing supply demand trading are not isolated to the Indian equities market. They are universal laws of auction mechanics that dictate price movement across global commodities, forex, and international export-import finance.
When you train your brain to identify massive imbalances in supply and demand on a stock chart, you are simultaneously developing a razor-sharp financial acumen that applies to broader global trading environments. The same institutional trust required to navigate massive cross-border export logistics is mirrored in the way deep-pocketed financial institutions maneuver their capital across the Nifty 50.
Whether you are bridging trade between Indian manufacturers and global buyers, or navigating the volatility of a financial derivative contract, the foundational rule remains identical: track the flow of institutional money, ignore retail noise, and execute with unyielding structural discipline.
Your Next Steps Forward
You now possess the foundational blueprint to stop being hunted by smart money. You understand the vulnerability of thin retail lines and the profound power of institutional order blocks.
But reading about supply demand trading is not enough. You must aggressively test it. Open your charting platform. Strip away all the complex, lagging indicators from your screen. Turn off the moving averages and the stochastic oscillators. Look at a naked price chart and start hunting for explosive price departures.
Draw your Proximal and Distal lines. Score your zones mathematically using the five-point checklist. Run a simulated backtest across three months of historical data to witness the edge materialize with your own eyes.
The market will open tomorrow at 9:15 AM, completely indifferent to your hopes or fears. It will operate purely on the mechanics of supply and demand. You can either continue to draw fragile retail lines and hope for the best, or you can align your capital with the massive, undeniable footprints of institutional wealth. Master supply demand trading, enforce your risk boundaries, and watch your execution clarity transform permanently.